library(tidyverse)Due on Thursday 22 January at 11:59 PM
Read these instructions before starting your homework and follow them carefully. See the end of this assignment for a checklist of components that your assignment must have at minimum to qualify for revision/resubmission. Only submit the items in that list, in the order requested.
Part 1. Tasks
Note
You will not need to submit any materials for tasks, but you are expected to complete the material/steps.
Task 1. Read the class guidelines and policies on using AI
If you think you might use any AI tools (e.g. Copilot, ChatGPT, Claude), read the guidelines and policies before starting your assignment.
Task 2. Set up your folders and .Rproj file
a. Create a new folder for this homework assignment within your ENVS-193DS folder.
Within the ENVS-193DS folder you set up, create a new folder for Homework 1. Name it whatever you want (a logical name could be homework-01).
b. Download the files from Canvas
Download the homework files from Canvas into your homework folder on your computer. This includes:
- the homework template
glacial_volume_loss.csv
glacial_volume_loss_copy.csv
c. Create an Rproject for this homework assignment
Create an Rproj file within your homework-01 folder. If you need help with this, watch the “Creating an Rproject” video on Canvas.
Task 3. Set up your code.
At the top of the template (or your own Quarto doc):
- Load the
tidyversepackage. Make sure the messages will not show up in your final document.
- Read in the data as an object called
glaciers.
glaciers <- read_csv("glacial_volume_loss_copy.csv")Task 4. Read about metadata from NOAA’s National Centers for Environmental Information
Read the overview page on metadata here to understand what metadata is.
Then, click through to the “Introduction to Metadata” page (under “Learn”) and read the questions that you should be able to answer with metadata.
You are now ready to start your homework!
Part 2. Problems, code, and figures
Problem 1. Measures of central tendency and data spread
Bird egg size can be an indicator of survival success of young birds - the more massive the egg, the higher the chances of survival. You’ve measured the following masses (in g) from a nest of California Towhee eggs:
\[ 3.92, 4.03, 4.15, 4.00, 4.10, 4.12 \]
- In one sentence, categorize this data set: what type of data did you collect, and why is it that type?
- Calculate the sample mean. Express your answer with the correct units and round to 2 decimal points. Show your work in code.
- Calculate the sample variance. Express your answer with the correct units and round to 2 decimal points. Show your work in code.
- Calculate the sample standard deviation. Express your answer with the correct units and round to 2 decimal points. Show your work in code.
Problem 2. Visualizing data
In this problem, you’ll work with data collected by the National Snow and Ice Data Center on glacial mass and sea level rise.
Before you start this problem, read about the data here.
Questions:
Open up the two data files (
glacial_volume_loss_copy.csvandglacial_volume_loss.csv) in Excel (or another program, if you use something different). Look at the files side-by-side. In one sentence, explain how the data files are different.Using the “Introduction to Metadata” information from Task 3, choose one question from the examples for “Who”, “What”, “Why”, “Where”, “When” and “How”. For example, there are 5 examples under “How”; you should choose one of those examples to address.
Answer the questions you chose using the information in the User Guide on the data page.
Each response should have the “question” (who, what, why, where, when, how), the example (“Who collected and processed the data?”), and your response. Format each as:
- Who: Who collected and processed the data? [insert response here]
- What: What are the data about? [insert response here]
- Why: Why were the data collected? [insert response here]
- Where: Where are the data located? [insert response here]
and so on. You should have one response for each question and example.
Choose the examples that are most relevant to the dataset!
Not all the examples from Task 3 will be relevant to this dataset. Read the examples and choose the most relevant ones based on what you learn about the dataset from the metadata and the user guide from the National Snow and Ice Data Center.
Before you start parts c and d
On paper, sketch out the axes for the histogram and the scatterplot. Label the axes, and write down the columns in the data frame you will need to use to make the figures. Draw the bars of the histogram and the points of the scatterplot.
By doing this before you code up your figure, you’ll be able to gain some intuition for what your figure should look like. You can then check your work against what you thought based on your drawing.
- Create a histogram of annual sea level rise using
ggplot(). Make sure you:
- label the x- and y-axes
- choose the correct number of bins
- use a different fill from the default and make the borders of the columns black
- use a different
ggplottheme from the default
- Create a timeseries plot with points and a line representing cumulative sea level rise through time using
ggplot(). Make sure you:
- label the x- and y-axes
- choose a different color from the default for the points and line
- use a different
ggplottheme from the default
Problem 3. Personal data
This quarter, you’ll collect data from your own life to see how data science concepts are part of your daily existence. For this homework assignment, you’ll come up with two ideas for data collection. The data you collect:
- has to be something you can get at least 30 observations on between week 4 and week 9 (e.g. minutes to get from ENVS 193DS to your next class, not number of shark views per week)
- has to be something that you could actually remember to write down (e.g. liters of water consumed in a day, not time spent on tiktok)
- has to be be shaped by a question
- has to include variables that would be appropriate to share with the class
For each idea you have (remember you have to come up with two ideas), you should:
- articulate a question
- describe your response variable (i.e. your variable of interest)
- describe your predictor variable
- describe what variables you should measure or record that indicate the time of the observation (for example: date or time of day)
- describe 4 additional variables you think you should measure or record that could also influence your response variable
- describe what type of data all your variables are with units
- describe the sources of your data (e.g. phone step tracker, screen time tracker, self)
- describe when you would take down data for an observation
- design a data sheet with some example data: what are the columns and what are the rows?
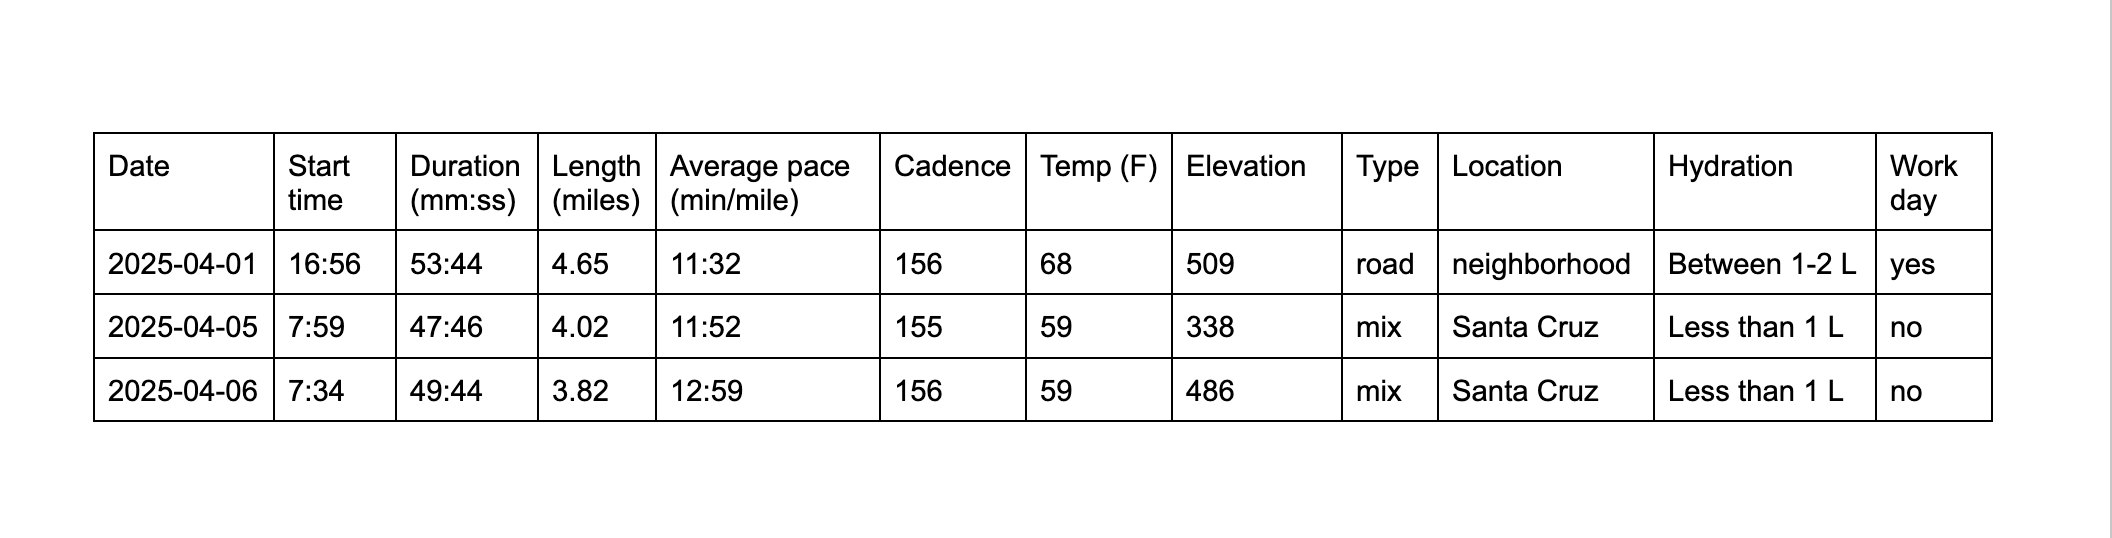
Need an example? Here’s An’s.
- Question: Does my run distance differ between work and non-work days?
- My response variable is length of run, measured in miles.
- My predictor variable is work day (yes or no).
- I would record the date and time of day.
- duration, average pace, cadence, temperature, elevation, type of run, run location, hydration level
- date (yyyy-mm-dd): continuous
- time of day (hh:mm, 24 hour time): continuous
- duration (mm:ss): continuous
- length (miles): continuous
- average pace (min/mile): continuous
- cadence (steps/min): continuous
- temperature (F): continuous
- elevation (feet): continuous
- type of run (road, trail, mix): categorical
- run location (neighborhood, front country, NCOS, other): categorical
- hydration level (> 2 L, between 1-2 L, less than 1 L): categorical
- work day (yes/no): binary categorical
Date, time of day, duration, length, average pace, cadence, temperature, and elevation are all variables that I could get from Strava (a running tracking app). The 4 additional variables that I could not get from Strava and could influence the length of my run are: type of run, run location, hydration level, and work day. I would assign these categories myself.
I would record my data after every run.
When can I start collecting data?
An will give you feedback and recommendations for what to pursue for this project on Canvas on Monday the 26th-Tuesday the 27th. That means that you should be able to start collecting data by the end of week 4, if not sooner.
Using ordinal scales
Lots of folks like to assign values to “productivity”, “restedness”, etc. For example, you could assign a study session some number between 1-5 in terms of productivity, where 1 is not at all productive and 5 is very productive.
If you plan on using a scale, you need to clearly articulate:
- what each number means (e.g. from a scale from 1-5, what does 1, 2, 3, 4, 5, mean), and
- how you would tell the difference between numbers (e.g. how would you tell the difference between 3 and 4)
Usually, this means you will have to determine what defines “productivity”. Is it number of pages you wrote in a paper? Does it mean the number of minutes spent in a word doc or R script? You have to decide what numerical tools you will use to assign a level to each “study session”.
Problem 4. Setting up statistical critique
Throughout the quarter, you’ll engage in a critique of statistical methods for a published paper. Some methods are appropriate for the data and research questions, and some are not. You’ll be the judge.
For this homework assignment, you will find 3 candidate papers for your critique. Find 3 papers that speak to your interests - the paper could be on human health, plant restoration, agroecology, or more. Anything you might be interested in within the realm of environmental studies is fair game. Not all 3 papers have to be on the same topic.
For each paper, read the Abstract to get a general sense of what the paper is about. Then, read the Methods section, looking for information on statistical analysis. A paper is a good choice if it includes one of these terms (or something similar) in the analysis description:
- t-test
- Analysis of variance (ANOVA)
- Mann-Whitney U
- Kruskal-Wallis
- Wilcoxon rank sum
- Linear model or linear regression
- Spearman correlation
- Pearson correlation
- logistic regression
- Generalized linear mixed effect model
- t-test
Once you’ve verified that your paper includes at least one of the above listed terms, find the digital object identifier (DOI), which is a unique identifier in the form of a URL for a paper. You will know it is a DOI if it has doi.org somewhere in the URL.
Once you find the DOI for your paper, add it to the Google form. Repeat this for all three papers.
Note
If you want to see what other people have chosen, see the class responses here.
- In your homework document, list the papers in alphabetical order by author last name.
Your citations should take the form:
Last name, first name, et al. Year. “Paper title.” Journal title volume:issue. DOI.
Example:
Sanford, E., et al. 2019. “Widespread shifts in the coastal biota of northern California during the 2014–2016 marine heatwaves.” Scientific Reports 9:4216. https://doi.org/10.1038/s41598-019-40784-3.
Assignment checklist
Your assignment should:
Your responses should include:
Additionally, you should:
Lastly, check out the rubric on Canvas to see the component breakdown in more detail.
General formatting components
You will only receive full marks for annotations if you have:
- meaningful comments on each line of visualization code and/or ggplot geom/theme call (not needed for each argument, though good to have)
- meaningful comments on each function in any piping operations
- meaningful comments in set up code to denote where packages and/or data are read in
You will only receive full marks for readability if:
- all messages/warnings are hidden
- all code is contained in code chunks (double check line breaks in comments once you render your document)
- all text is where it’s supposed to be (all components like headers, main text, superscripts/subscripts, etc. show up correctly)
- code includes carriage returns, spaces, etc. to make pipe operations and arguments clear
- code includes consistent spacing and indents
Frequently Asked Questions
I’m having trouble rendering to PDF. What can I do?
You could either install all the additional things R is asking for you to install, or you can render to a word doc instead (change pdf in the top part of the document to docx) and save that doc as a PDF.
I don’t know how to insert an image into a Quarto document. How do I do that?
Here is a resource for Quarto. If you rendered your Quarto file to a word document, you can insert an image into that word document the same way you would with any other word doc.
Where is the feedback for problem 4?
It is in the google sheet.