# function 1
filter(!(date == "2000-09-22" & transect == "6" & quad == "40"))

# function 2
mutate(site_name = as_factor(site_name),
       site_name = fct_relevel(site_name,
                               "Naples", "Isla Vista", "Carpinteria"))

# function 3
clean_names()

# function 4
ungroup()

# function 5
group_by(site_name, year)

# function 6
filter(site %in% c("IVEE", "NAPL", "CARP"))

# function 7
summarize(mean_fronds = mean(fronds))

# function 8
mutate(site_name = case_when(
  site == "NAPL" ~ "Naples",
  site == "IVEE" ~ "Isla Vista",
  site == "CARP" ~ "Carpinteria"
))Due on Tuesday 17 March at 11:59 PM
Getting help from the instructional team
As usual, you are welcome to come to drop-in hours, email for meetings, etc.
If you are working with classmates (which we encourage you to do!), you are welcome to try to make a group meeting (i.e. you and some friends get help together). You and your peers can email to set up a meeting time (that works for all of you) to answer questions outside of drop-ins.
Set up
a. GitHub steps
- Name the repo
ENVS-193DS_winter-2026_final, write a description, initialize with a README.
b. RStudio steps
- Clone the repository to your computer.
- Create a
codeand adatafolder. - Start a new Quarto or Rmarkdown document in the
codefolder. - Download any data you need into your
datafolder. - Insert a link to your GitHub repo at the top of your document.
- In your new Quarto document, create a code chunk at the top to read in any packages or data.
- Throughout the course of completing this portion of the final, commit and push changes at least 10 times.
- Write a README with a “General information” section, “Data and file overview” section, and a “Rendered output” section.
- Link to the rendered .html in your “Rendered output” section.
Problem 1. Research writing
Skills you will demonstrate
In this problem, you will demonstrate your ability to identify gaps in statistical communication and justify why those gaps should be filled.
Additionally, you will demonstrate your ability to write about statistics without a complete analysis or the information you would need.
Problem
You’re working on a research team trying to understand how environmental variables influence wetland flooding area (measured in m2) in the San Joaquin River Delta. Your co-worker runs some analyses and writes up a report, giving it to you to review. In part 1 of the results section of the report, your co-worker has written:
We retained the null hypothesis that precipitation doesn’t predict flooded wetland area (p = 0.11).
In part 2 of the results section of the report, your co-worker has written:
We retained the null hypothesis that median flooded wetland area does not differ across water year classification (wet, above normal, below normal, dry, critical drought) (p = 0.12).
It’s great that this report is coming together, but you think they can improve on what they’ve written and make it more understandable to a non-statistical audience.
a. Transparent statistical methods
What statistical tests did your co-worker use?
Clearly connect the test to the part that you are addressing (e.g. “In part 1, they used _______. In part 2, they used _______.”).
b. Figure needed
The test in part 2 seems familiar to you, but you think your coworker could provide additional context using a visualization for their test.
Describe one figure that your coworker could make to accompany the statement in part 2.
Be specific about what variables should be on the x-axis, the y-axis, and the visual components of the plot as they relate to the test in addition to naming the type of plot they should make.
c. Suggestions for rewriting
In 1-3 sentences, write new research statements to include relevant components from parts a-b and a full test summary in parentheses to be transparent about the statistical method.
Be sure that your rewritten statements clearly delineate the biological narrative from the statistical summary. See lecture and workshop for examples of writing.
Note that your co-worker didn’t include any information about the test statistic, distribution, etc., and that you only know the p-value. For any part that you do not know, list that part with text. For example, you could write something like: “…\(\alpha\) = significance level …”
d. Interpretation
Based on your co-worker’s analyses, flooded wetland area isn’t affected by precipitation or by the classification of the water year.
In 1-2 sentences, outline:
- one additional variable that could influence the flooded area of a wetland,
- what type of variable it is, and
- why that variable might influence wetland flooding.
Understand the biological context before answering this question!
The information in this problem is drawn from this paper:
Peterson, Sarah H. et al. 2025. “Flooded Wetland Availability for Breeding Waterfowl in a Mediterranean Climate: Mapping 38 Years of Historical Data in Suisun Marsh, California.” San Francisco Estuary and Watershed Science 23:4. doi: 10.15447/sfews.2025v23iss4art3.
The authors outline what may have influenced wetland flooding, specifically management actions in the region. How would that translate to a variable you would propose in this problem?
Problem 2. Data visualization
Skills you will demonstrate
In this problem, you will demonstrate your ability to find, clean, summarize, and visualize a data set. You will use data from the Santa Barbara Coastal LTER on giant kelp fronds.
Note that the instructions do not include all the steps you need to do on purpose. You will need to use your skills in working backwards from a final product (the visualization given to you) to determine the steps to get there.
Problem
Navigate to the SBC LTER’s data catalog. Find and download the dataset on giant kelp fronds in the Santa Barbara Channel to your data folder. (Hint: the page on the data catalog is called “KFCD abundance and size of giant kelp”.)
In your set up chunk, read in the data as an object called kelp.
a. Cleaning and summarizing
Create an object called kelp_clean from kelp.
To clean and summarize the data frame, use the functions in the following code chunk. Only use these functions.
The functions are out of order. Put the functions in the right order and use the pipe operator to get the data frame you need.
Annotate each function to demonstrate your understanding of its use.
When you are done with all your cleaning steps:
- display 5 rows from
kelp_cleanusingslice_sample()and - the structure using
str()
b. Understanding the data
The code chunk above includes a line that filters out frond observations from the date 2000-09-22 in transect 6 in quad 40.
In 1-2 sentences, describe why. What is the number for the value of fronds in that “quad” in that “transect”? What does that value represent? Reference the specific place you found information on what that value represents (e.g. in the Summary tab of the data page).
c. Visualize the data
Recreate this visualization:
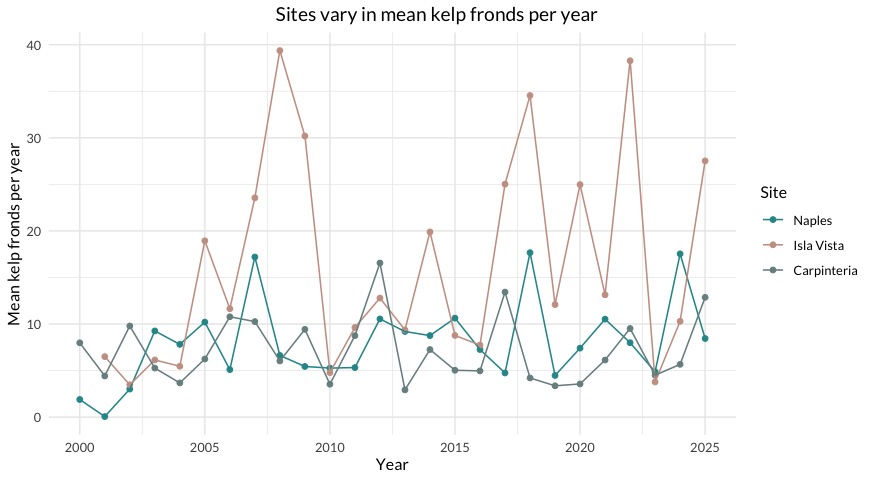
The specific aesthetic components you need to recreate are:
edited 2026-03-11: took out requirement for legend position within panel
- the geometries (there are two)
- the text (all axis and legend text, and the title)
- different, custom colors for each site
- the title position
- the panel (a grid without the border)
- use of a custom font (that is consistent across all text in the figure)
d. Interpretation
In 1-2 sentences each, describe:
- the site with the most variable mean kelp fronds per year
- the site with the least variable mean kelp fronds per year
Be specific with the visual components of the plot to support your characterization.
Problem 3. Data analysis
Skills you will demonstrate
In this problem, you will demonstrate your ability to understand a data set that someone else collected and identify and execute the appropriate statistical method, with all assumption checks. Additionally, you will demonstrate your ability to visualize and communicate about the results of your statistical test.
You will be working with the nest box occupancy dataset from Duchardt, Courtney J., JL Beck, DJ Augustine. 2020. “Mountain Plover habitat selection and nest survival in relation to weather variability and spatial attributes of black-tailed prairie dog disturbance.” The Condor 122:1. doi: 10.1093/condor/duz059.
The data citation is: Duchardt, Courtney; Beck, Jeffrey; Augustine, David (2020). Data from: Mountain Plover habitat selection and nest survival in relation to weather variability and spatial attributes of Black-tailed Prairie Dog disturbance [Dataset]. Dryad. https://doi.org/10.5061/dryad.ttdz08kt7
You should be using the MOPL_nest-site_selection_Duchardt_et_al._2019.csv file.
edited 2026-03-11: included name of file
You will answer the following research questions:
- How does visual obstruction at the nest and distance to Prairie dog colony edge affect probability of Mountain Plover nest site use?
- Is there a simpler model that explains probability of Mountain Plover nest site use, and if so, what is it?
READ THE INTRODUCTION AND METHODS BEFORE YOU START.
Problem
Before doing the following parts…
Read in your data in the set up chunk, storing it as a new object called mopl.
Do any exploring you need to do (exploratory visualizations, etc.) but DO NOT include any code or output from your data exploration.
Note that you may have some cleaning/wrangling steps to do. Do them before running your models!
Not sure how to write code but hide it and/or its output from the final rendered document? Check here for options.
a. Response variable
In 1-2 sentences, explain what the 1s and 0s mean in this data set biologically.
b. Purpose of study
In this problem, you will be examining the potential effects of visual obstruction and distance to prairie dog colony edge on the probability of a nest site being occupied by a Mountain Plover.
In 2-3 sentences for each predictor, describe:
- what kind of variable it is (i.e. continuous, discrete, categorical, etc.),
- how it could possibly influence the probability of Mountain Plover nest site use (i.e. as visual obstruction increases, the probability of Mountain Plover nest site use would ______________ because…), and
- where in the paper you found this information (the specific section, subsection, and paragraph)
c. Table of models
Make a table of all the models you will need to run. You will run 4 models: a null model, a saturated model, and two other models with different combinations of predictors.
Stuck on how to create a table? See workshop 8 for an example.
Your table should have 4 columns: (1) model number, (2) visual obstruction, (3) distance to prairie dog colony, and (4) model description.
d. Run the models
Create a clean dataset to use called mopl_clean. In no particular order:
- clean the column names
- create a new column called
used_binto create 1s and 0s from theidcolumn - select
used_bin,edgedist, andvo_nest
edited 2026-03-11: included instructions for cleaning data
Then, write your code to run all your models. Do not display any output.
e. Select the best model
Using Akaike’s Information Criterion (AIC), choose the best model.
In text, write what the best model was (i.e. “The best model as determined by Akaike’s Information Criterion (AIC)…”).
Use the predictors and the response variable to describe the model, not the model number that you assigned.
f. Check the diagnostics
Check your diagnostics for the model you selected using simulated residuals from the DHARMa package.
Display all code and output.
g. Visualize the model predictions
Create a plot showing model predictions for your selected model with 95% confidence intervals around the predictions and the underlying data.
Show and annotate all code. Show the output.
For full credit:
- make sure the x- and y-axis labels are written in full with units if necessary
- take out the gridlines
- use colors that are different from the default
h. Write a caption for your figure.
Include a figure number, title, description of the figure, and data citation.
i. Calculate model predictions
Calculate the predicted probability of Mountain Plover nest site occupancy at 0 on the index of visual obstruction.
Show and annotate all code. Display the output.
j. Interpret your results
Write 3-5 sentences summarizing what you found, making references to the figure you made in part h and the predictions you calculated in part j. Your summary should include your interpretation of:
- the predicted probability of nest site occupancy at 0 (no visual obstruction)
- what relationships, if any, exist between visual obstruction and distance to prairie dog colony and probability of occupancy
- the biology behind the trends you found - what explains the relationship between visual obstruction and probability of Mountain Plover nest site occupancy?
Read the discussion!
The authors contextualize the potential effects of these variables on the probability of nest use by Mountain Plovers. Read the discussion to understand the biology!
Problem 4. Affective and exploratory visualizations
Skills you will demonstrate
In this problem, you will demonstrate your ability to communicate about your visualization and give feedback to others. You will also demonstrate your ability to design and execute an appropriate statistical analysis for your data.
Problem
a. Comparing visualizations
Compare and contrast your affective visualization from Homework 3 and the exploratory visualizations you made for Homework 2. In 1-3 sentences each, explain:
- How are the visualizations different from each other in the way you have represented your data?
- What similarities do you see between all your visualizations?
- What patterns (e.g. differences in means/counts/proportions/medians, trends through time, relationships between variables) do you see in each visualization? Are these different between visualizations? If so, why? If not, why not?
- What kinds of feedback did you get during week 9 in workshop or from the instructors? How did you implement or try those suggestions? If you tried and kept those suggestions, explain how and why; if not, explain why not.
b. Designing an analysis
Based on your response variable and one of your potential predictor variables (your focal variable or otherwise), propose one analysis that we talked about this quarter that you could apply to answer your research question(s).
Additionally, explain why this analysis is appropriate with regard to:
- your question
- your variables and what types of variables they are
c. Check any assumptions and run your analysis
In this section, create two subsections (in the appropriate order) to:
- check any assumptions
- run the analysis you proposed in part b
- (if applicable) calculate an effect size
Show all code and output.
d. Create a visualization
Create a visualization that reflects the analysis you ran in part c (i.e. if you compared medians, you should create a plot representing medians; if you built a model, you should show predictions and confidence intervals).
For full marks, your plot should:
- have labelled x- and y-axes with units
- use a different theme than the default
- use different colors than the default
- show the underlying data
e. Write a caption
Write a caption for the figure you created in part d. Include a figure number, title, description of visual components (including but not limited to shapes, colors, lines, etc.).
f. Write about your results
In 2-4 sentences, write about your results (with appropriate components in the parenthetical statistical summary).
Include any components that would provide additional context to your interpretation (e.g. differences in means) or allow you to quantify the magnitude of effects (e.g. effect sizes).
g. Sharing your affective visualization
This is a component you will complete in workshop during week 10. We will be taking attendance that day. If you attend class and complete the activity, you will receive full credit for this section.
Double check your assignment!
On Canvas, you will submit two links:
- the link to your GitHub repository
- the link to your rendered html
Your GitHub repository should:
Your rendered html should:
Additionally, your rendered html should include only the components listed below:
for Problem 1:
for Problem 2:
for Problem 3:
for Problem 4:
Lastly, check out the rubric on Canvas to see the point breakdown in more detail.